Introduction
The concept of capacity limitation and its relationship to bottlenecks is widely accepted as a well-understood topic. The truth is perhaps a little different and is often driven due to the complexity and lack of visibility that exists in some industrial environments. The idea that the slowest part of a production line sets the pace for the whole line is easy to grasp and understand, never more so than when the product can be physically seen moving from raw material or components to finished product in a linear progression from one process step to another. Understanding becomes more challenging when 1. The product can not be seen at any stage and even more difficult when some kind of reprocessing is built into the prime process at one or multiple stages and 2. The product changes state from liquids to gases and back and is incredibly difficult to measure flow when in the process. The process industry offers this somewhat unique challenge and with it comes an opportunity that is difficult to understand and quantify and progressively more challenging to realize. With capacity gains from 10 to 40% typically possible, this is a rich environment for those equipped to navigate and realize the potential.
What is a Bottleneck?
A bottleneck is a point in a process where the rate of production is limited by the availability of some resource, such as raw materials, labour, or machines. A bottleneck can also be caused by a lack of storage space or transportation capacity.
The different Types of Bottleneck
Bottlenecks fall into two general categories – Structural bottlenecks and Temporary bottlenecks
A structural/capacity bottleneck is limited by a planned or physical limitation that exists all of the time. It is usually a fixed point in the process and would not be expected to move. There are some circumstances where this is not true but those should be considered exceptions.
A temporary/production bottleneck will always degrade the capacity further than the structural bottleneck. It will not be permanent in nature and is often located at a different point in the process. Examples that could cause this would include equipment not operating correctly, reduction in normal labour supporting processes, abnormal material, and abnormal plant services. When the words “moving bottleneck” are used it is normally in relation to an abnormal operational condition.
Recognizing which bottleneck type is active is essential to establishing both the opportunity for improvement and establishing the likely solution required.
Process Industry Process Types
Batch Process – In a pure batch environment the key to understanding the batch step causing the restriction is a function of batch time, batch volume, and quality. And usually ends up looking like a throughput measure relating to good kilos per hour. All stages where the batch moves through are considered and the bottleneck stage is the one with the lowest throughput. Usually, there are limited changes to the relative mass of the in-process material in( Pure Batch) so each stage can be compared to the others in a rudimentary way. It is also easy to calculate Real OEE based on the lowest throughput stage. It is essential that any lost time between batches is factored into this thinking and a timeframe used which will include all product types and demand patterns in combination with any effects of seasonality. The real potential exists in two places the first is identified using a classic waste analysis and this exposes losses driven by “production/temporary bottleneck” the less obvious but often significantly more beneficial area is analyzing in detail the areas that are typically referred to as value adding and exposing the opportunity to do things even better or differently.
Continuous Process – In a continuous process there are nearly always changes in relative mass during the process, there are also often recycle/feedback lops designed into the asset to attempt to optimize material yield. These two single factors make the actual identification of the bottleneck very challenging. A further complication lies in the lack of real flow data as most plants are populated with instrumentation to help steer or control the process (temperature, pressure, vacuum measurements but don’t usually have significant instrumentation across the process measuring mass flow. It’s not uncommon to measure only output flow and derive material consumption based on a standard formula or measure primary raw material input and estimate output based on a defined formula. This is usually adequate to support business system (ERP) requirements but wholly incapable of assisting with capacity optimization.
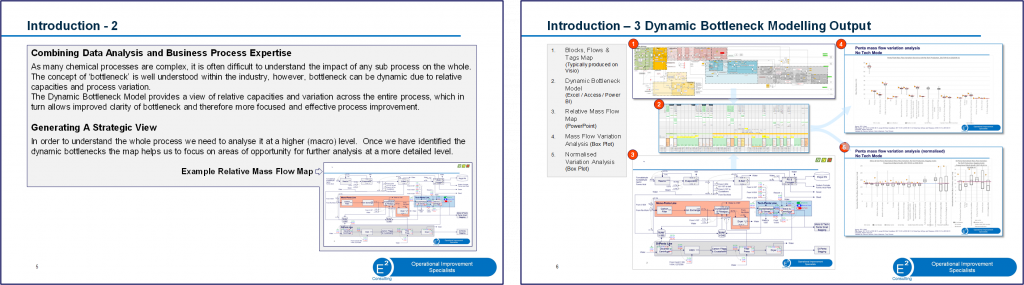
E-Squared has a very specific and unique process to model the relative mass flows within the entire system (See Figure 1) in a section-by-section fashion so that the process section limiting output can be identified and targeted. We typically model over very extended periods to ensure we can fully account for all product volumes in a net zero mass balance scenario.
Hybrid Process – In a hybrid environment sections of the process flow follow a batch regime whilst the remaining parts use a continuous flow structure. Depending on the relative mix of methodologies and overall process complexity assessing bottlenecks and throughputs can be very similar to either batch (generally straightforward) or very close to the complexity of a continuous plant.
How to solve/improve bottlenecks
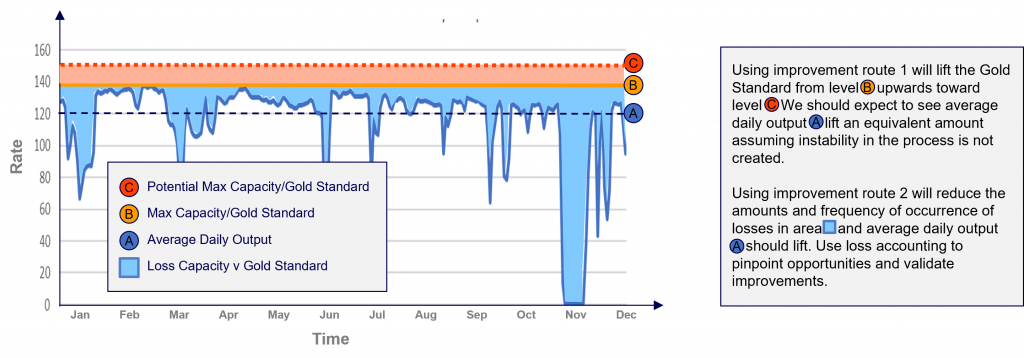
With the bottlenecks fully understood and the best capability/golden standards defined, there are two routes to improvement (See Figure 2).
- (1) Improve the rate of the bottleneck process. The gold standard rises to a new gold standard.
- (2) Reduce unplanned losses/problems which cause the rate to run below the gold standard.
To address No.1 a deeper understanding using full process functional analysis is required. This forces us t0 dissect the process into micro-sections, and understand the purpose and function of every micro-section from both an asset perspective and a process perspective. Process and asset expertise is crucial during this activity as when we understand what the functions and outputs are we immediately pose a number of questions (1) Is it needed? (2) If the function is needed, can it be done differently or at another non-bottleneck stage of the process? (3) is the functional requirement actually being achieved and if not how might we make it better?
To attack No. 2 all losses versus that gold standard must be captured in as close to real-time as possible and on an ongoing basis. Losses will broadly fall into two categories, planned and unplanned. Planned losses could be reduced rate to reflect demand from the marketplace or planned shutdown to allow preventative maintenance activity. Unplanned losses would cover everything from poor raw material driving yield problems and extra rework to asset failure requiring unplanned stoppage to allow repairs. The loss capture system is a key tool in the CI armoury and looks and works a little differently depending if in a batch or continuous process environment.
For either area, improvements tend to be small and incremental. There are rarely “silver bullets” so to achieve large results many small improvements are usually required, this is time-consuming but more importantly, requires real structure so the right opportunities are tackled in the correct order to realize the best result.
What scale of improvement can be expected?
The scale of improvement potential is largely driven by the process style. Typically batch processes have much more scope for improvement than a continuous process. A potential capacity increase of up to 10% is not unusual in a continuous process but anything up to 40% is regularly seen in a batch process with extreme examples being even higher.
Conclusion
Many organizations default to CAPEX when additional capacity is required, there is clearly a place for that, and depending on the scale of change required CAPEX may be the correct choice, with a fully analyzed asset CAPEX when required becomes materially more targeted and the shotgun approach often adopted can be avoided along with the unnecessary cost associated with it.
Truly understanding product flow through an asset and truly understanding the bottlenecks and what drives them allows significant potential improvement to be explored in a non or limited capex way. Operational improvements addressed this way are always more cost-effective than capex and can always be delivered on a timeline far superior to that of plant upgrades or modifications.